Raporty
Dobry raport, to raport dopasowany do potrzeb. Nasz system powala użytkownikom tworzyc samodzielnie raporty, które następnie mogą być dystrybuowane przez serwer subksypcji.
Oszczędzaj czas swoim zespołom ds. danych, przedstawicielom obsługi klienta i programistom, wykorzystując nasz mechanizm tworzenia raportów.
Wszyskie niezbędne dane masz już w naszym systemie. Wystarczy, że zaprojekujesz raport online i możesz się cieszyć prezentowanymi wynikami.
W naszym sytemie ofertujemy dwa rodzaje tworzenia raportów:

Raporty przestawne
Tabela przestawna to interaktywny sposób szybkiego podsumowywania dużych ilości danych.
Za pomocą tabeli przestawnej możesz szczegółowo analizować dane liczbowe i odpowiadać na nieoczekiwane pytania dotyczące danych.
Tabela przestawna jest specjalnie zaprojektowana do: wyszukiwania dużych ilości danych na wiele przyjaznych dla użytkownika sposobów
- wystarczy, ze przeciągniesz interesujące Cię pole.

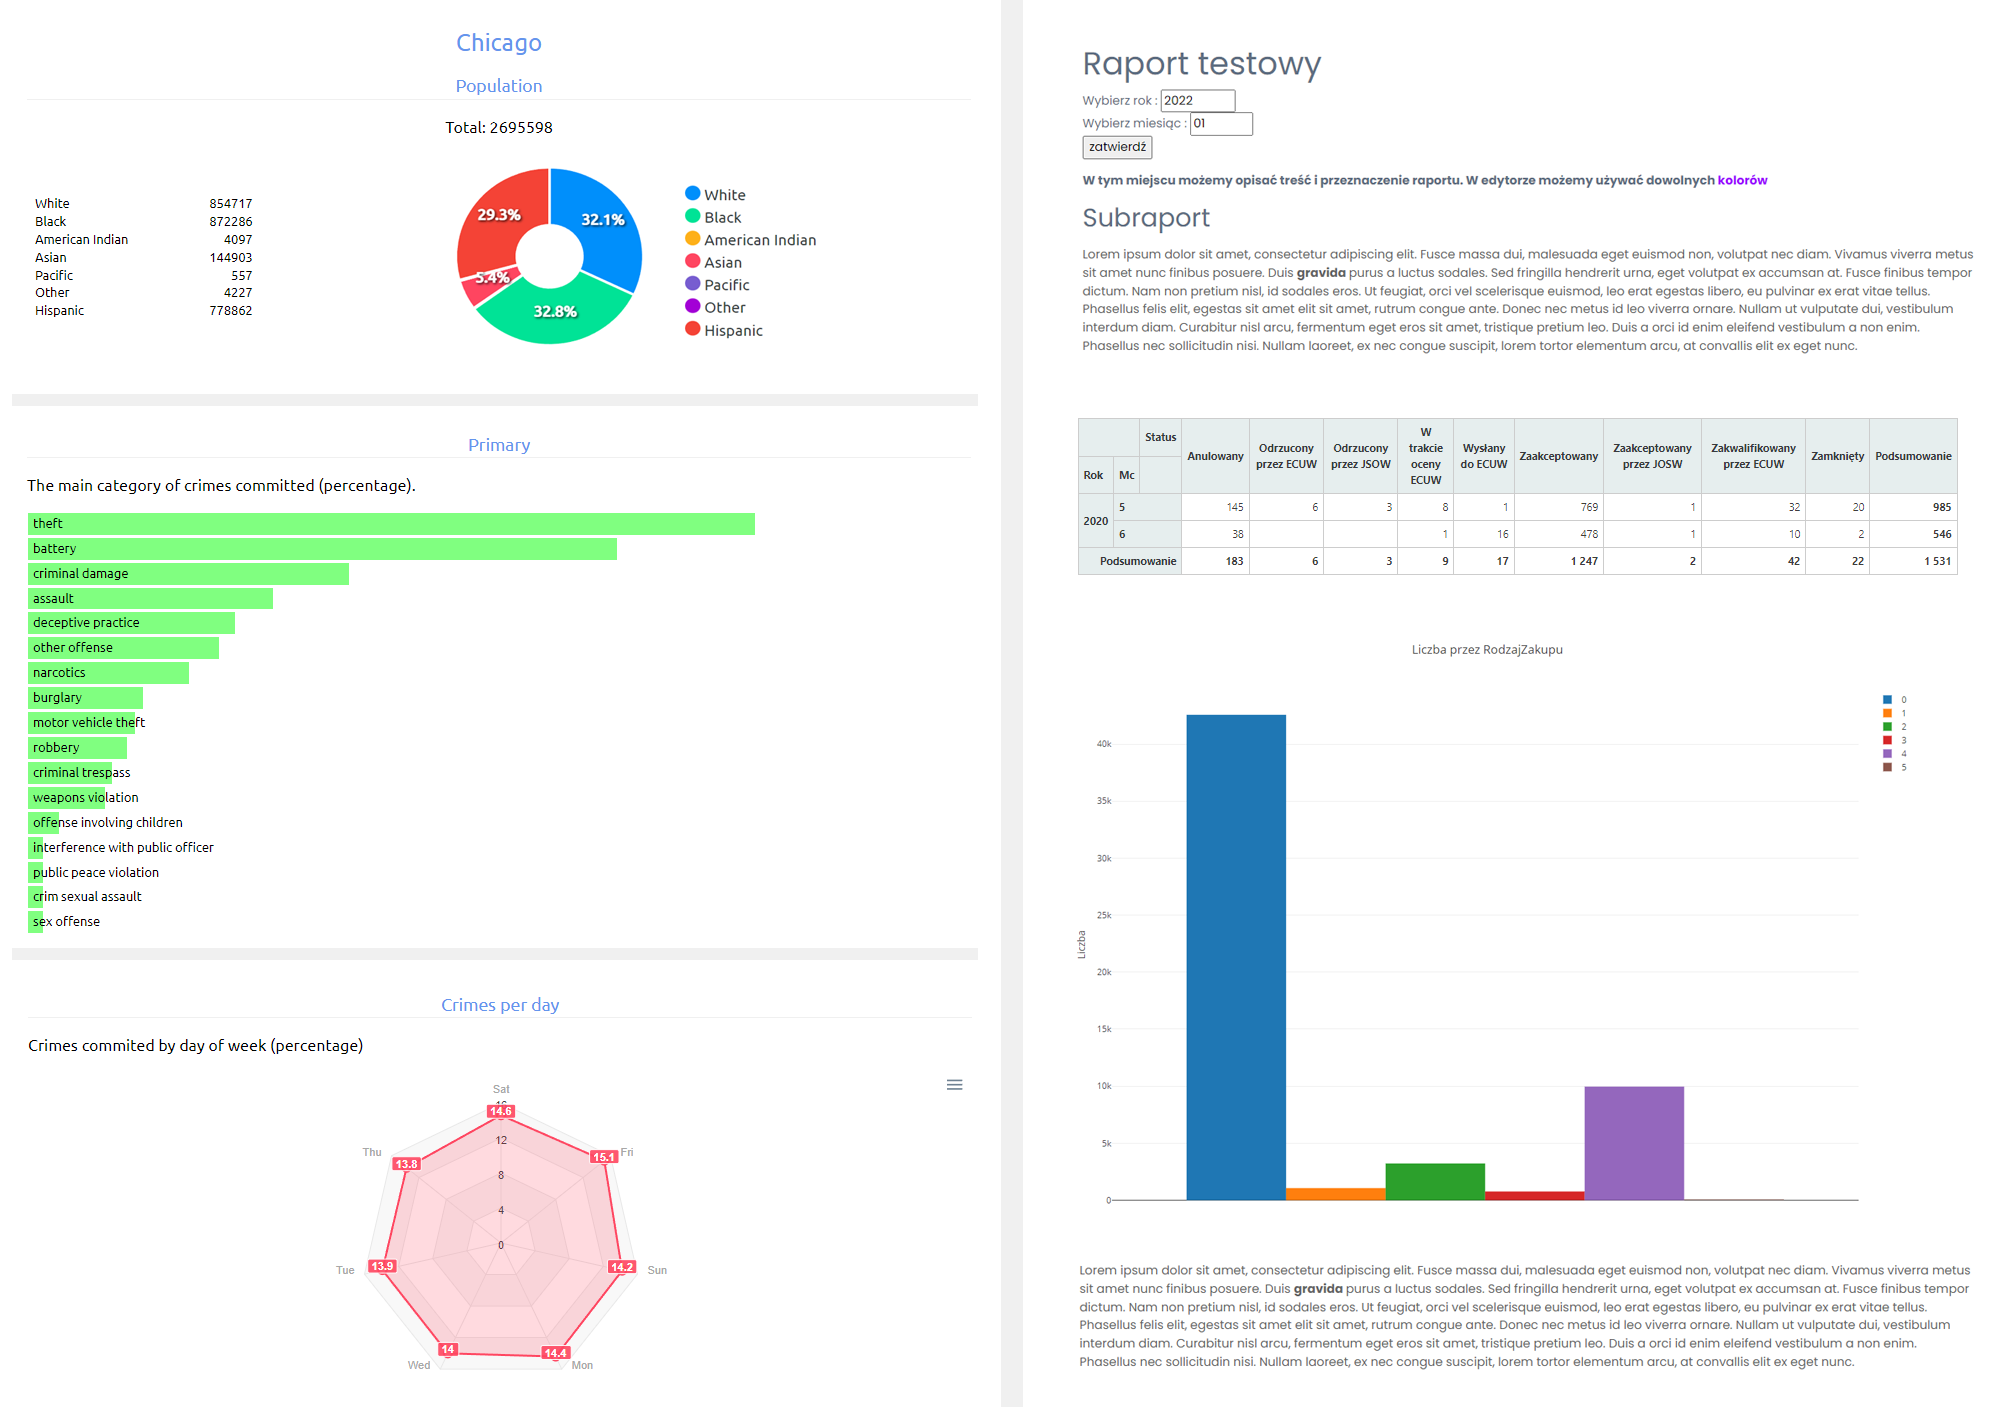
Raporty definiowane
Samodzielnie możesz zaprojektować złożony raport z dowolnego zakresu danych. Możesz uzupełnić go o treści oraz dane z bazy.
Bardzo łatwo osadzisz tabele danych oraz wykres. Możesz również osadzić w raporcie wynik raportu przestawnego.
Oddajemy Ci narzędzie, które ma dostęp do wszyskich danych w systemie, a gotowe raporty, dzięki serwerowi subskrypcji, będą docierały do odbiorców na czas.